
MOS 7.0: Logging, Monitoring, Alerting (LMA) enhancements
- December 14, 2015
The LMA toolchain is a relatively new project, but it already has contributors among the big telcos, so it's probably no surprise that it has been designed from the ground-up to be scalable, extensible, and capable of integrating with existing monitoring systems. Think of it as composable suite of tools focusing on operational health and response for OpenStack clusters.
The main idea of this set of tools is that it collects “everything” (logs, notifications, service states, metrics and so on), and turns it into internal structured messages. In contrast to “conventional” monitoring tools such as Zabbix, it is based on a decentralized stream processing architecture, opinionated about what’s important to monitor and how, and aims to deliver insightful data to consumers out-of-the-box.
Perhaps most importantly, this toolchain was designed to scale for humans. In other words, it's synthetic, with no alerting sprawl. In other words, we made a distinction between what is truly indicative of a critical condition that must be acted upon immediately (alert), versus what can be deferred (diagnose). We knew how important this aspect of usability was, because we were already using the LMA toolchain in our own Scalability Lab, where clusters of hundreds of nodes are the norm.
Furthermore, conventional monitoring solutions tend to alert operators on binary conditions such as: “this process has failed", "a service is not responding", "CPU has crossed a 95% utilisation threshold", "root filesystem is near 100% full", and so forth. A modern monitoring solution should instead answer questions like:
To cope with that challenge, Mirantis has created the LMA (Logging, Monitoring, Alerting) Toolchain project, which consists of both the framework itself and a number of different plugins that use that framework. The LMA toolchain is composed of a collection of finely integrated best-of-breed open-source applications that bring the operational visibility and insights you need to effectively operate your OpenStack infrastructure. To facilitate its deployment, the LMA toolchain is packaged and delivered as Fuel plugins that you can seamlessly deploy using the graphical user interface of Fuel. The LMA toolchain is also designed from the ground-up to be massively scalable, easily extensible, and easily integratable with existing IT operations tooling.

The logs analytics and metrics analytics services of the LMA Toolchain -- namely, the InfluxDB-Grafana and Elasticsearch-Kibana services of the LMA Toolchain -- support the visualization.
The analytics can be installed internally or externally to the OpenStack environment. We often refer to them as satellite clusters. When using Fuel plugins, the satellite clusters are installed within the OpenStack environment on separate nodes.
Note: Installing the LMA Toolchain satellite clusters on an OpenStack controller node or collocated with other Fuel plugins is not recommended nor supported.
You can also connect custom satellite clusters to the LMA Collector, as long as Heka supports the protocol and data serialization format.
To facilitate this integration, we have created an Infrastructure Alerting Plugin that is based on Nagios that you can deploy along with other LMA Toolchain plugins. The Infrastructure Alerting Plugin is configured to receive passive checks from the LMA Aggregator. These checks are turned into email notifications when the availability status of a cluster entity has changed state. A cluster entity can be a node cluster such as ‘compute' or ‘storage’ or a service cluster such as ‘nova’, or a more fine-grained service cluster such as ‘nova-api’ or ‘nova-scheduler’. Nagios can be configured with an InfluxDB driver so that it is also possible to create alarms for metrics by querying the time-series provided by the Influxdb-Grafana Plugin, as shown in the figure below.
The objective for LMA 0.9 is to go beyond that number with one order of magnitude bigger deployments and to also eliminate all single points of failure. As such, the LMA Toolchain Fuel plugins will enable deployment of both InfluxDB and Elasticsearch in highly available and scale out clusters. In addition to that, the interconnect from the Collectors and the Aggregator to the storage clusters will be mediated through a Kafka message broker to avoid the congestion points (and thus loss of data) that would inevitably occur with point-to-point connections in deployments of thousands of nodes.
The main idea of this set of tools is that it collects “everything” (logs, notifications, service states, metrics and so on), and turns it into internal structured messages. In contrast to “conventional” monitoring tools such as Zabbix, it is based on a decentralized stream processing architecture, opinionated about what’s important to monitor and how, and aims to deliver insightful data to consumers out-of-the-box.
Perhaps most importantly, this toolchain was designed to scale for humans. In other words, it's synthetic, with no alerting sprawl. In other words, we made a distinction between what is truly indicative of a critical condition that must be acted upon immediately (alert), versus what can be deferred (diagnose). We knew how important this aspect of usability was, because we were already using the LMA toolchain in our own Scalability Lab, where clusters of hundreds of nodes are the norm.
What we needed the LMA toolchain to do
The conventional monitoring solutions we have been using since the 1990s fall short with respect to addressing the monitoring needs of OpenStack in a way that can scale both with the growth of your cloud infrastructure.Furthermore, conventional monitoring solutions tend to alert operators on binary conditions such as: “this process has failed", "a service is not responding", "CPU has crossed a 95% utilisation threshold", "root filesystem is near 100% full", and so forth. A modern monitoring solution should instead answer questions like:
- Are my services running healthy, and if not, how much are they degraded?
- Will my services continue to be running healthy in the (near) future?
- What happened that caused my services to stop running healthy?
- What should I do to make my services run healthy again?
To cope with that challenge, Mirantis has created the LMA (Logging, Monitoring, Alerting) Toolchain project, which consists of both the framework itself and a number of different plugins that use that framework. The LMA toolchain is composed of a collection of finely integrated best-of-breed open-source applications that bring the operational visibility and insights you need to effectively operate your OpenStack infrastructure. To facilitate its deployment, the LMA toolchain is packaged and delivered as Fuel plugins that you can seamlessly deploy using the graphical user interface of Fuel. The LMA toolchain is also designed from the ground-up to be massively scalable, easily extensible, and easily integratable with existing IT operations tooling.
The LMA toolchain architecture and components
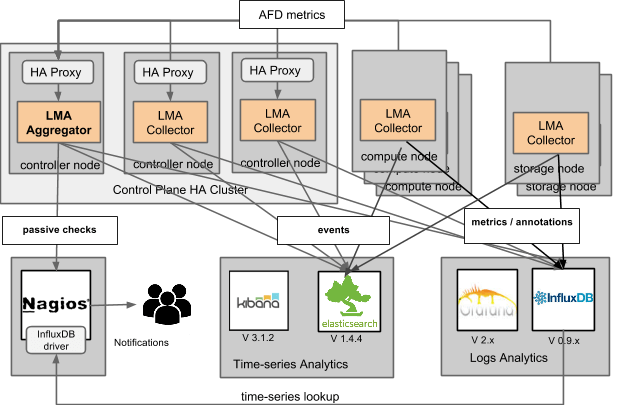
The toolchain is comprised of seven key elements that are interconnected at the interface level as shown in the figure below. Best-of-breed applications that specialize in handling the task at hand in the most effective way support each element.How the toolchain collects and processes logs, metrics and the OpenStack notifications in an efficient manner
The operational data is collected from a variety of sources, including logfiles, collectd and RabbitMQ (for OpenStack notifications). There's one Collector per node monitored; the Collector that runs on the active controller of the control plane is called the Aggregator because it performs additional aggregation and multivariate correlation functions to compute service healthiness metrics at the cluster level. An important function of the Collector is to sanitize and transform the raw operational data into an internal message representation that uses the Heka message structure. That structure is used to match, filter, and route certain categories of messages to their particular destination for processing and persistence to the backend servers.The logs analytics and metrics analytics services of the LMA Toolchain -- namely, the InfluxDB-Grafana and Elasticsearch-Kibana services of the LMA Toolchain -- support the visualization.
The analytics can be installed internally or externally to the OpenStack environment. We often refer to them as satellite clusters. When using Fuel plugins, the satellite clusters are installed within the OpenStack environment on separate nodes.
Note: Installing the LMA Toolchain satellite clusters on an OpenStack controller node or collocated with other Fuel plugins is not recommended nor supported.
You can also connect custom satellite clusters to the LMA Collector, as long as Heka supports the protocol and data serialization format.
How the toolchain supports effective alerting and can integrate with alerting systems like Nagios
The LMA toolchain doesn’t impose yet another built-in alerting and escalation solution. Instead, we think it is more effective to make the LMA Collector interoperate with an alerting and escalation solution, such as Nagios, that is widely used across the industry.To facilitate this integration, we have created an Infrastructure Alerting Plugin that is based on Nagios that you can deploy along with other LMA Toolchain plugins. The Infrastructure Alerting Plugin is configured to receive passive checks from the LMA Aggregator. These checks are turned into email notifications when the availability status of a cluster entity has changed state. A cluster entity can be a node cluster such as ‘compute' or ‘storage’ or a service cluster such as ‘nova’, or a more fine-grained service cluster such as ‘nova-api’ or ‘nova-scheduler’. Nagios can be configured with an InfluxDB driver so that it is also possible to create alarms for metrics by querying the time-series provided by the Influxdb-Grafana Plugin, as shown in the figure below.
What’s next: Scaling the LMA toolchain to process millions of logs and metrics
Next version of LMA (LMA v 0.9) is going to target massive scaling and clustering. At the moment, the plan is to release LMA 0.9 concomitantly with Mirantis OpenStack 8.0 (though of course scheduling of either may change). Today, the performance testing we have done on a 200-node test harness shows that LMA v 0.8 already provides acceptable performance and scales fairly well using the current point-to-point connections architecture. This is due to the fact that LMA is scalable by design because monitoring is distributed across all the Collectors.The objective for LMA 0.9 is to go beyond that number with one order of magnitude bigger deployments and to also eliminate all single points of failure. As such, the LMA Toolchain Fuel plugins will enable deployment of both InfluxDB and Elasticsearch in highly available and scale out clusters. In addition to that, the interconnect from the Collectors and the Aggregator to the storage clusters will be mediated through a Kafka message broker to avoid the congestion points (and thus loss of data) that would inevitably occur with point-to-point connections in deployments of thousands of nodes.

