
StackLight - the Logging, Monitoring and Alerting (LMA) toolchain of Mirantis OpenStack
- May 12, 2016
In a post of December 2015, I introduced the concepts and base building blocks underpinning the so-called Logging, Monitoring and Alerting (LMA) Toolchain of Mirantis OpenStack, now officially called StackLight. The purpose of this second post is talk about what’s new in StackLight 0.9 (compatible with Mirantis OpenStack 8.0), which you can download from the Fuel Plugins Catalog.
The depth and breadth of the new features we have added in this release is quite significant as outlined below. The main theme of these features revolves around resiliency and scale requirements.
Setting up a StackLight cluster is actually quite simple because all the heavy lifting work is done for you automatically and transparently by the plugins. All you need to do is to assign the StackLight Fuel plugins roles to nodes in your environment and deploy, as shown in Figure 1.
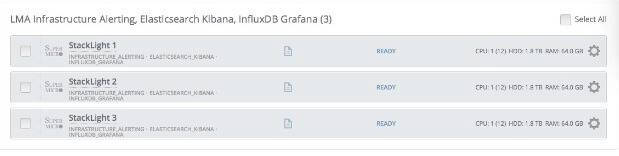
Figure 1: Assigning roles to StackLight servers
One improvement from StackLight 0.8 is the fact that StackLight 0.9 is composed of hot-pluggable plugins, which means that it is possible to deploy your StackLight cluster after you have deployed your OpenStack environment, throughthough installation of the Collectors on the OpenStack nodes requires a configuration change and a restart of all the OpenStack services.
We've created a video overview and demo of Stacklight. Check it out!
The depth and breadth of the new features we have added in this release is quite significant as outlined below. The main theme of these features revolves around resiliency and scale requirements.
Clustering of the backend servers for high availability and scale
There are still four Fuel plugins in the toolchain, but in StackLight 0.9, those plugins can be deployed on a cluster of nodes for high availability and scale. Note that the cluster of nodes can be made of physical machines or virtual machines using the Reduced Footprint feature of Fuel.Setting up a StackLight cluster is actually quite simple because all the heavy lifting work is done for you automatically and transparently by the plugins. All you need to do is to assign the StackLight Fuel plugins roles to nodes in your environment and deploy, as shown in Figure 1.
Figure 1: Assigning roles to StackLight servers
One improvement from StackLight 0.8 is the fact that StackLight 0.9 is composed of hot-pluggable plugins, which means that it is possible to deploy your StackLight cluster after you have deployed your OpenStack environment, throughthough installation of the Collectors on the OpenStack nodes requires a configuration change and a restart of all the OpenStack services.
InfluxDB-Grafana Plugin highlights:
The InfluxDB-Grafana Plugin also has some additional new features, including:- Upgrade to InfluxDB 0.10.0 with clustering support (considered beta by InfluxData).
- The TSM storage engine is advertised by InfluxData to sustain write load of more than 350K points per sec on a fast disk (ideally an SSD).
- The InfluxDB cluster must have at least 3 meta nodes in order to form a Raft consensus.
- Clustering is used for HA (not scale as all time-series are replicated in the cluster) for both InfluxDB and Grafana.
- Added configurable retention period in the plugin settings (30 days by default).
- Fuel plugin support for InfluxDB clustering includes:
- Deployment of InfluxDB on one or three nodes. The deployment of InfluxDB on two nodes (for data replication) is technically possible but it is not recommended (nor supported) as there may be situations where the failover will not work properly.
- The ability to add and remove nodes after deployment via the Fuel UI.
- All nodes are both meta nodes and data nodes.
- The time-series are synchronously replicated on all nodes.
- The API endpoint VIP is managed by HAProxy and Pacemaker.
Elasticsearch-Kibana Plugin highlights:
New features in the Elasticsearch-Kibana plugin include:- Upgrade to Elasticsearch 1.7.4, bringing better resiliency, new features, security fixes, clustering stability and recovery improvements.
- Clustering, used for both scale and HA for both Elasticsearch and Kibana.
- The cluster must have at least three nodes to avoid split-brain issues.
- Configurable retention period in the plugin settings (30 days by default).
- Fuel plugin support for Elasticsearch clustering includes:
- Cluster size up to five nodes
- All nodes store data and can be elected master
- Five shards per index type per day
- Data is replicated on all nodes but is configurable in the plugin settings
- The ability to add and remove nodes after deployment via Fuel UI
- The API endpoint VIP is managed by HAProxy and Pacemaker
Logs monitoring
A high rate of errors in the logs is often an indication that something is going wrong and should be acted upon. The good news is that an unusual error rate in the logs can now be detected thanks to a new log_messages metric that contains a logging rate value per severity level and per service. As with any other metric, the log_messages metric can be added to an alarm rule that will fire an anomaly and fault detection (AFD) metric if the logging rate, for a given severity level, such as ‘ERROR’, exceeds a threshold.Worker alarms per node
Prior to StackLight 0.9, it wasn’t possible to know on which node a particular OpenStack worker was down. This information is now captured and displayed in the Grafana dashboards for all the OpenStack core services dashboards.Libvirt Instances Monitoring
Stacklight 0.9 introduces the monitoring of libvirt instances. Ceilometer is not used at this stage and so the instances metrics are not tagged with Nova metadata such as the tenant ID. A new Hypervisor Grafana dashboard was created to visualize those metrics instead. It is possible to visualize the libvirt metrics in the Hypervisor dashboard by node name, instance ID, disk and interface name dimensions.How to get StackLight 0.9
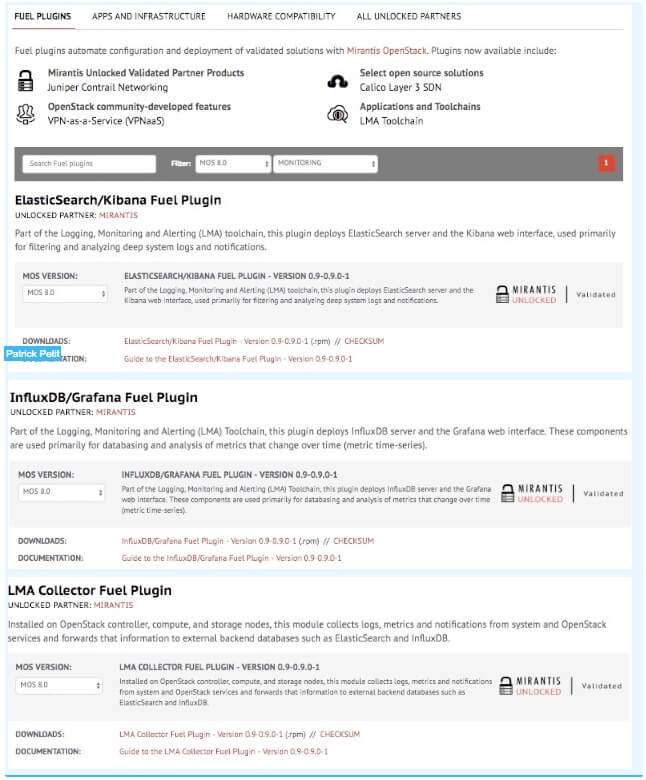
To get started with StackLight 0.9, first deploy Mirantis OpenStack 8.0. From there, you can go to the Fuel Plugins Catalog and search for MOS 8.0 plugins in the MONITORING category as shown belowStackLight.We've created a video overview and demo of Stacklight. Check it out!

