Stackalytics.com: Who's growing the OpenStack Pie
The OpenStack community is nearing 10,000 members in nearly 100 countries, with foundation support by more than 200 companies. Wondering who all those people are and what they’re doing? We did too. That’s why today we are announcing the release of our latest open source tool, Stackalytics.com.
Statistics are critical to turning data into information, and everyone needs detailed information in order to make decisions, especially in fast moving cloud technology. Since here we practically wallow in code day in and day out we find it useful to know what’s really going on with our development, and how our fellow contributors are participating in the community.
OpenStack Analytics: Stackalytics
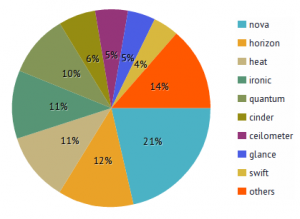
 Stackalytics is a data visualization tool that collects data from GitHub and presents it in an array of useful forms. Not only can Stackalytics break down the data into companies, projects, and contributors, but it also lets you track commits and overall lines of code.
All of the collected data is collated and linked so you can drill down into different projects, contributing companies, and even individual contributors for a more detailed view. Want to know how much attention the Cinder project is getting for the upcoming Havana release? Just choose Havana in the pulldown at the top, then click on the project name. Do you want to see what work has made Mirantis the #4 code contributor to OpenStack? Just click the company name.
Lines and Commits
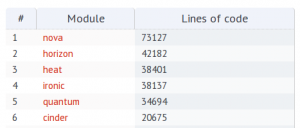
One of the more important metrics that illustrates work hours and productivity is the number of commits made against the lines of code produced by developers. A commit is a unit of work that is performed by a developer when they create, fix, or delete some code in a particular module. This code is then processed by Gerrit, Jenkins, and/or SmokeStack, reviewed by at least two core developers, and is finally merged into the Master Branch. Lines of Code (or LoC) is the number of actual lines of code that are created, fixed, or deleted.
The difference between these two is critical because the values can show project managers where the team’s productivity is yielding results. Consider a developer who produces 5,000 lines of code and yet only has a handful of small commits. Alternately, a developer who produces 400 lines of code might have dozens of commits. This kind of information can help project managers better guide their projects and developers. Additionally, you can compare one company's progress with your own or others. For greater detail into the development tracks being taken on various projects, you can also examine the project blueprints used by the developers to manage the planned changes and improvements.
Of course, that information won’t mean as much if you can’t effectively navigate the collected data. We’ve set up the data view to be configured to show what you are looking for. You can pick individual releases and see lines of code or just commits. You can choose to look at the project view, giving you a 10,000 ft. view, or drill deep into module details to see exactly which commitments have been made by which developers.
Search and Drilldown
In addition to the view selectors, you can also dynamically search for information. Each column of data has a search field at the top. Enter search terms and watch as the results change, which helps you find what you’re looking for. Every list has a search field, making it faster and easier to find something specific. Finally, if the default of 25 results isn’t enough, you can use the selector to change how many items are displayed.
Now that you’ve seen the picture of top-down results of OpenStack community work, you might be interested in bottom up. First, if you’re trying to see how quickly changes are getting into OpenStack, check out the Zuul project page. Unlike its predecessor projects such as you might find at The Apache Software Foundation, OpenStack is continuously integrated as code is committed and validated; Zuul provides pipeline oriented project gating and automation system that produces a continuously integrated updated code base. The rate of change is graphed at the bottom. Second, if you’re interested in examining the pulse of specific changes to specific projects day-to-day, take a look at the OpenStack Foundation’s activity trackers. The browser gives a day-to-day pulse of activities at the micro-level. You can also search the individual changes based on who made them at the company and individual level using the OpenStack Community Insights browser.
Stackalytics Project Roadmap
As you come back up out of the depths of day-to-day activity, you can get a sense of how much developer work OpenStack and its associated projects represent. Helping visualize the collective results, on a scale of releases you might choose to adopt -- that’s what we set out to do with Stackalytics. There are other projects and other ways to slice the data, and we’re only just getting started.
A few future improvements you can look forward to include that addition of review statistics to lines of code and commits, a well-documented API that will enable developers to leverage Stackalytics data, and Stackalytics widgets you can add to your website by copying and pasting a few lines of code. We’re also working on an interface and workflow for peer driven corrections and updates to committer attributions. (In other words, if you leave one company and go to another, you can provide this data yourself so your work is attributed correctly.)
Want to see something else? We’ll have the project posted on stackforge soon so you can hack at the code yourself. Or, drop us a comment below.


