Because we wanted to keep the book Service Mesh for Mere Mortals short and consumable, there was a lot of interesting (but peripheral) content we had to cut. We did, however, want to make sure it was available to you if you want it, so we're presenting it here.Troubleshooting k0s installation
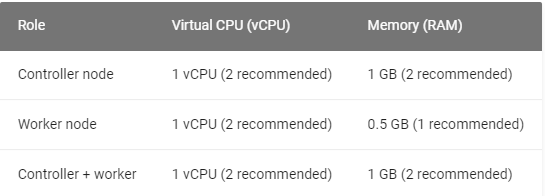
For the sake of thoroughness and to assist the reader in how the Kubernetes installation is being executed, I am including some charts and diagrams of the environment and physical characteristics of the platforms involved to provide a more complete picture. From a platform perspective, you will need, at a minimum, three physical or virtual servers to start. The layout of the configuration should look something like this: Note: Use an SSD boot device for optimal storage performance.Below are some of the specifics regarding the version of Operating Systems supported and specific architectures.
Host operating system
- Linux (kernel v3.10 or later)
- Windows Server 2019
Architecture
In-cluster networking
k0s supports two Container Network Interface (CNI) providers out-of-box, Kube-router and Calico. In addition, k0s can support your own CNI configuration.Notes
- When deploying k0s with the default settings, all pods on a node can communicate with all pods on all nodes. No configuration changes are needed to get started.
- Once you initialize the cluster with a network provider the only way to change providers is through a full cluster redeployment.
More on kube-router and Calico networking
Kube-router
Kube-router is built into k0s, and so by default the distribution uses it for network provision. Kube-router uses the standard Linux networking stack and toolset, and you can set up CNI networking without any overlays by using BGP as the main mechanism for in-cluster networking.- Supports armv7 (and the other architectures listed above)
- Uses a small amount of resources (~15%)
- Does NOT support dual-stack (IPv4/IPv6) networking
- Does NOT support Windows nodes
Calico
In addition to Kube-router, k0s also offers Calico as an alternative, built-in network provider. Calico is a layer 3 container networking solution that routes packets to pods. It supports, for example, pod-specific network policies that help to secure kubernetes clusters in demanding use cases. Calico uses the vxlan overlay network by default, and you can configure it to support ipip (IP-in-IP).- Does NOT support armv7
- Uses bit more resources
- Supports dual-stack (IPv4/IPv6) networking
- Supports Windows nodes
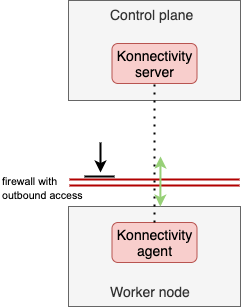
Controller-Worker communication
One goal of k0s is to allow for the deployment of an isolated control plane, which may prevent the establishment of an IP route between controller nodes and the pod network. Thus, to enable this communication path (which is mandated by conformance tests), k0s deploys Konnectivity service to proxy traffic from the API server (control plane) into the worker nodes. This ensures that we can always fulfill all the Kubernetes API functionalities, but still operate the control plane in total isolation from the workers.Note: To allow Konnectivity agents running on the worker nodes to establish the connection, configure your firewalls for outbound access.
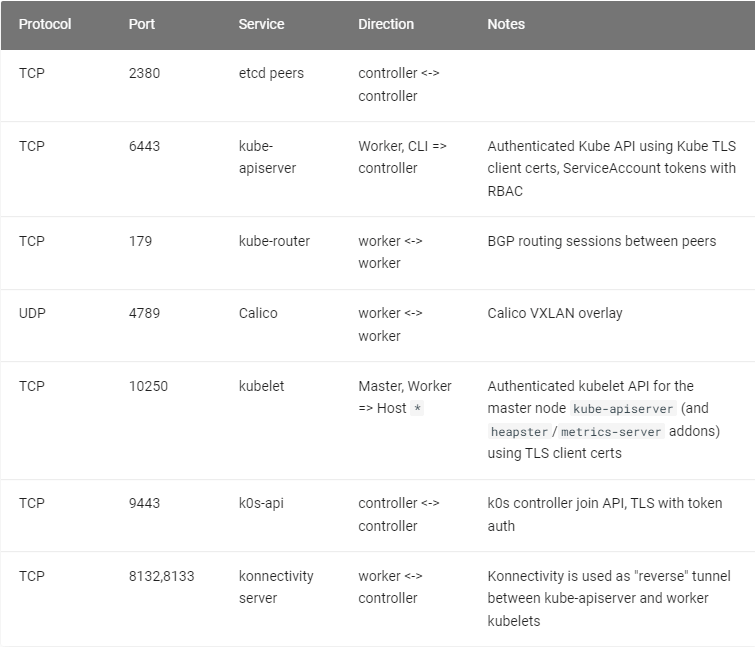
Required ports and protocols

k0s and multiple hosts
$ sudo chmod +x k0sctl
- Move the k0ctl binary to a location available in your $PATH variable by issuing the following command as an example:
$ sudo mv k0sctl /usr/local/bin- Run the following command to create a k0sctl configuration file:
$ k0sctl init > k0sctl.yamlNOTE: The k0sctl.yaml file will look something like this:apiVersion: k0sctl.k0sproject.io/v1beta1
kind: Cluster
metadata:
name: k0s-cluster
spec:
hosts:
- role: controller
ssh:
address: 10.0.0.1 # replace with the controller's IP address
user: root
keyPath: ~/.ssh/id_rsa
- role: worker
ssh:
address: 10.0.0.2 # replace with the worker's IP address
user: root
keyPath: ~/.ssh/id_rsa
Change the contents of the k0sctl.yaml file to include the third node as a "Worker" and to provide each host with a proper IP address that is reachable by k0ctl, and the proper connection details to establish an SSH connection. The new version of the file should look something like this:apiVersion: k0sctl.k0sproject.io/v1beta1
kind: Cluster
metadata:
name: k0s-cluster
spec:
hosts:
- role: controller
ssh:
address: 192.168.1.1
user: root
keyPath: ~/.ssh/id_rsa
- role: worker
ssh:
address: 192.168.1.2
user: root
keyPath: ~/.ssh/id_rsa
- role: worker
ssh:
address: 192.168.1.3
user: root
keyPath: ~/.ssh/id_rsa
Deploy the cluster by issuing the following command:$ k0sctl apply --config k0sctl.yaml
At this point you should be able to access the running Kubernetes cluster by issuing the following commands:$ k0sctl kubeconfig > ~/.kube/config
$ kubectl get pod
The output from the last command should look something like this:NAMESPACE NAME READY STATUS RESTARTS AGE
kube-system calico-kube-controllers-5f6546844f-w8x27 1/1 Running 0 3m50s
kube-system calico-node-vd7lx 1/1 Running 0 3m44s
kube-system coredns-5c98d7d4d8-tmrwv 1/1 Running 0 4m10s
kube-system konnectivity-agent-d9xv2 1/1 Running 0 3m31s
kube-system kube-proxy-xp9r9 1/1 Running 0 4m4s
kube-system metrics-server-6fbcd86f7b-5frtn 1/1 Running 0 3m51s
You are now ready to install Istio into the running cluster!Looking at the bookinfo.yaml file
I am including several sections of the bookinfo.yaml file provided below for reference. The sections of the file are labeled as to what each section addresses:The following shows how the Service and Service Account are defined for the BookInfo application:##################################################################################################
# BookInfo Details service
##################################################################################################
apiVersion: v1
kind: Service
metadata:
name: details
labels:
app: details
service: details
spec:
ports:
- port: 9080
name: http
selector:
app: details
---
apiVersion: v1
kind: ServiceAccount
metadata:
name: bookinfo-details
labels:
account: details
This section defines the Deployment of the Bookinfo application
# BookInfo Deployment
apiVersion: apps/v1
kind: Deployment
metadata:
 name: details-v1
 labels:
   app: details
   version: v1
spec:
 replicas: 1
 selector:
   matchLabels:
     app: details
     version: v1
 template:
   metadata:
     labels:
       app: details
       version: v1
   spec:
     serviceAccountName: bookinfo-details
     containers:
     - name: details
       image: docker.io/istio/examples-bookinfo-details-v1:1.16.2
       imagePullPolicy: IfNotPresent
       ports:
       - containerPort: 9080
       securityContext:
         runAsUser: 1000
This section defines the Deployment of the Ratings portion. Note the three versions.
# Ratings Deployment
apiVersion: apps/v1
kind: Deployment
metadata:
 name: ratings-v1
 labels:
   app: ratings
   version: v1
spec:
 replicas: 1
 selector:
   matchLabels:
     app: ratings
     version: v1
 template:
   metadata:
     labels:
       app: ratings
       version: v1
   spec:
     serviceAccountName: bookinfo-ratings
     containers:
     - name: ratings
       image: docker.io/istio/examples-bookinfo-ratings-v1:1.16.2
       imagePullPolicy: IfNotPresent
       ports:
       - containerPort: 9080
       securityContext:
         runAsUser: 1000
apiVersion: apps/v1
kind: Deployment
metadata:
 name: reviews-v2
 labels:
   app: reviews
   version: v2
spec:
 replicas: 1
 selector:
   matchLabels:
     app: reviews
     version: v2
 template:
   metadata:
     labels:
       app: reviews
       version: v2
apiVersion: apps/v1
kind: Deployment
metadata:
 name: reviews-v3
 labels:
   app: reviews
   version: v3
spec:
 replicas: 1
 selector:
   matchLabels:
     app: reviews
     version: v3
 template:
   metadata:
     labels:
       app: reviews
       version: v3
This section defines the ProductPage Service that displays the Review page in your browser
##################################################################################################
# Productpage Services
##################################################################################################
apiVersion: v1
kind: Service
metadata:
 name: productpage
 labels:
   app: productpage
   service: productpage
spec:
 ports:
 - port: 9080
   name: http
 selector:
   app: productpage
---
apiVersion: v1
kind: ServiceAccount
metadata:
 name: bookinfo-productpage
 labels:
   account: productpage
---
apiVersion: apps/v1
kind: Deployment
metadata:
 name: productpage-v1
 labels:
   app: productpage
   version: v1
spec:
 replicas: 1
 selector:
   matchLabels:
     app: productpage
     version: v1
 template:
   metadata:
     labels:
       app: productpage
       version: v1
In addition to the BookInfo Deployment, deploying Istio's Prometheus and Grafana Add-Ons provide the details for the four major categories of metrics:- Latency
- Traffic Flow
- Error Count
- Saturation Point
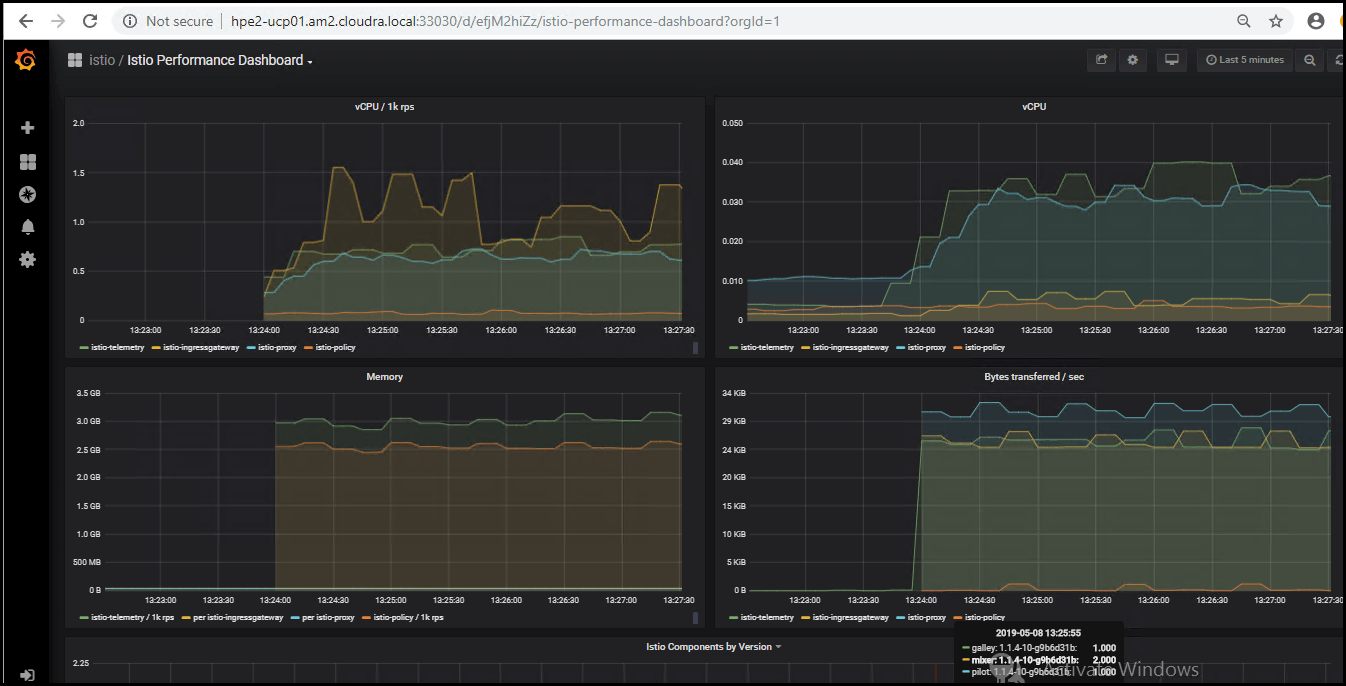
Istio Grafana

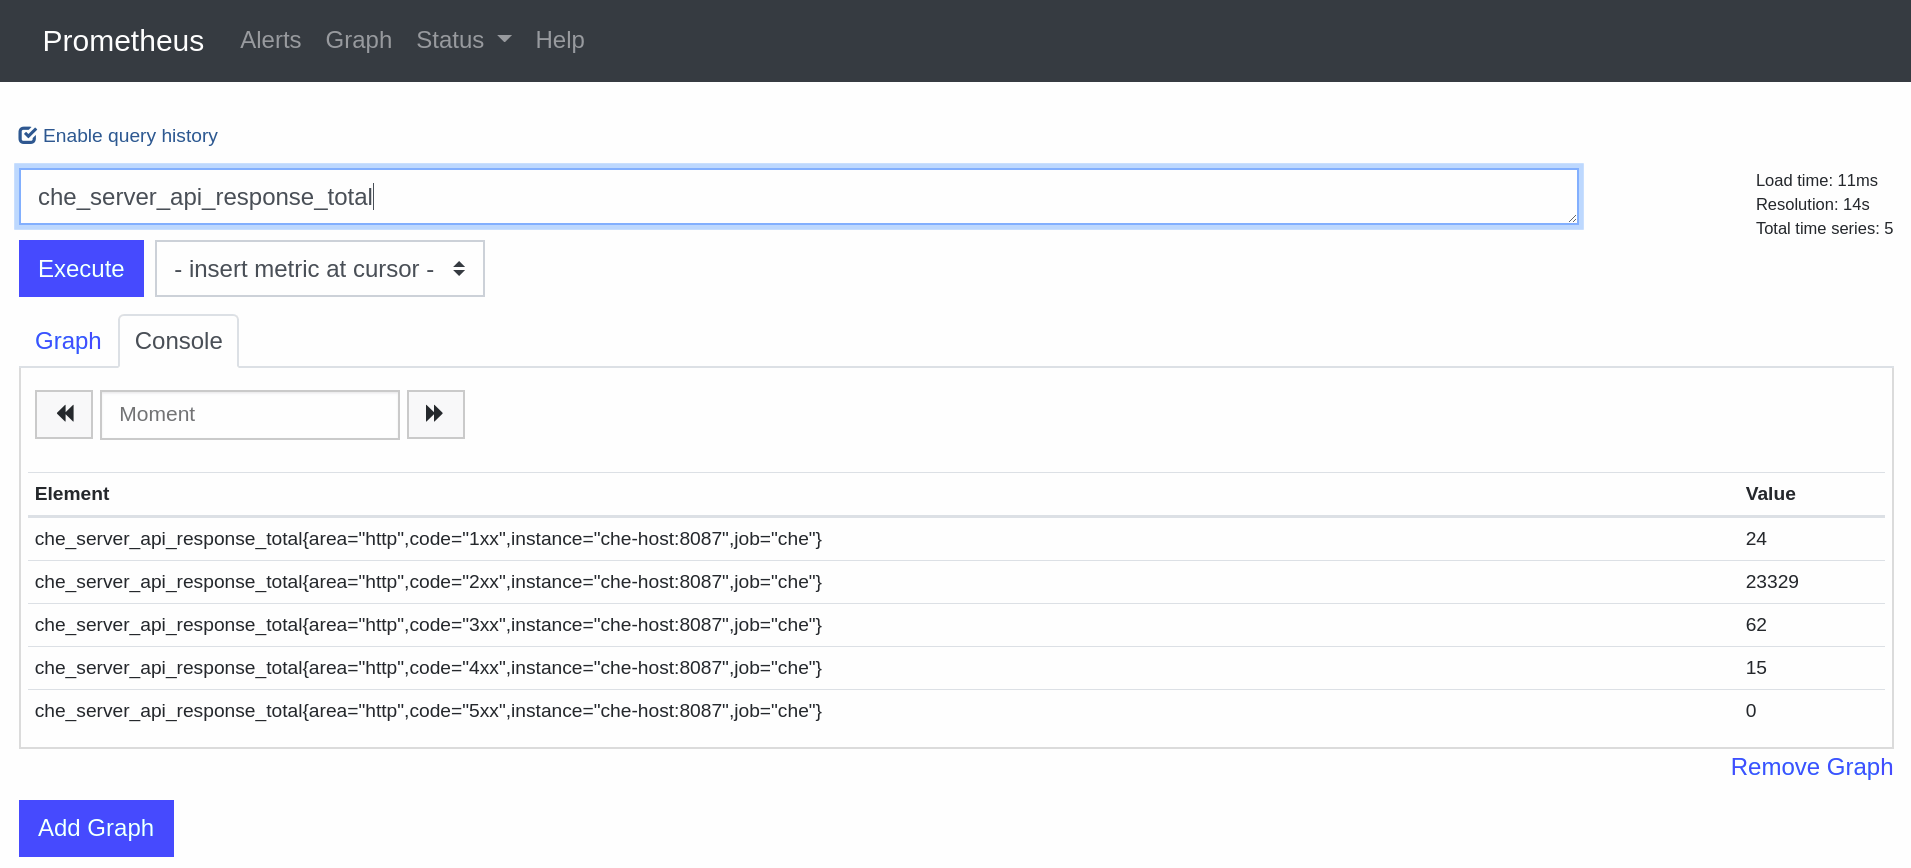
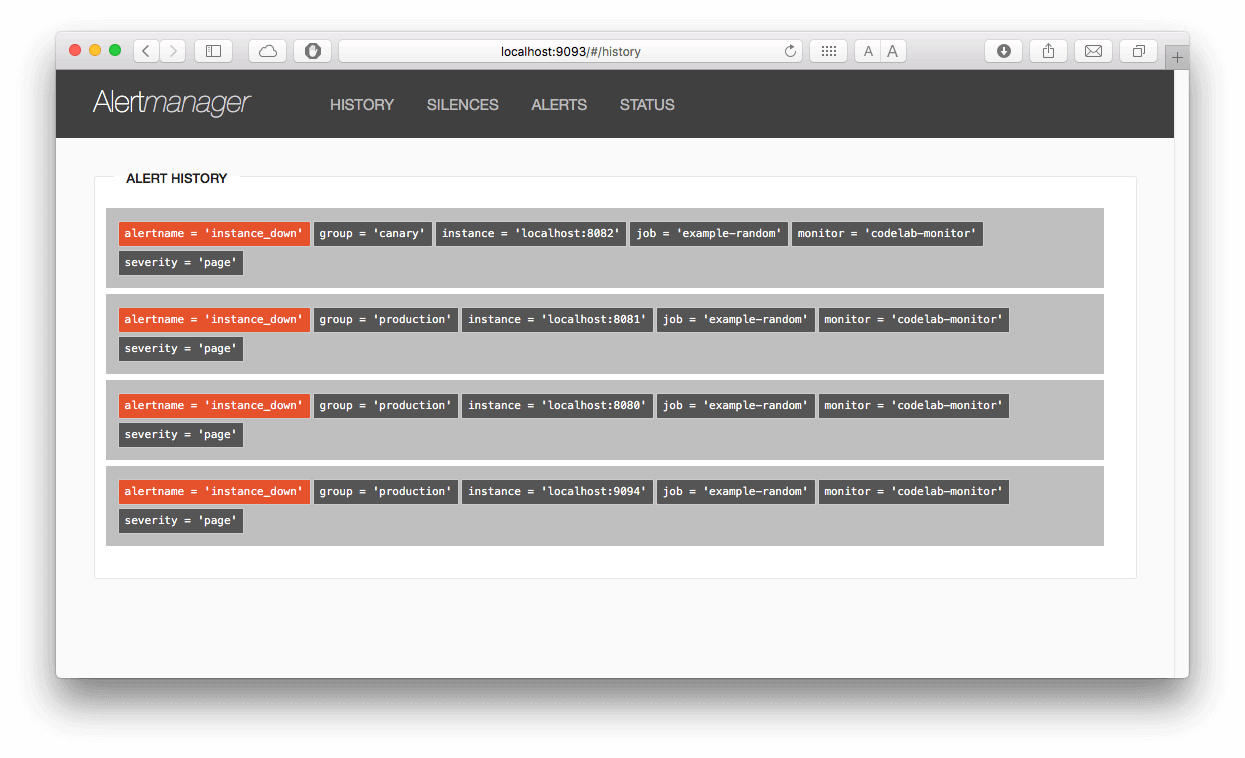
Istio Prometheus

Istio Prometheus AlertManager
 Moving to the next part of Telemetry that needs to be captured to effectively manage and maintain an application we move from the Observability tools defined above to the Traceability tools described below to provide the complete picture of the BookInfo application from the Istio Service Mesh's perspective. Part of the Istio Add-Ons includes complete traceability for EVERYTHING that goes into and out of the Istio Service Mesh. Jaeger and Zipkin provide this capability currently. Images of the interface are provided below for reference.
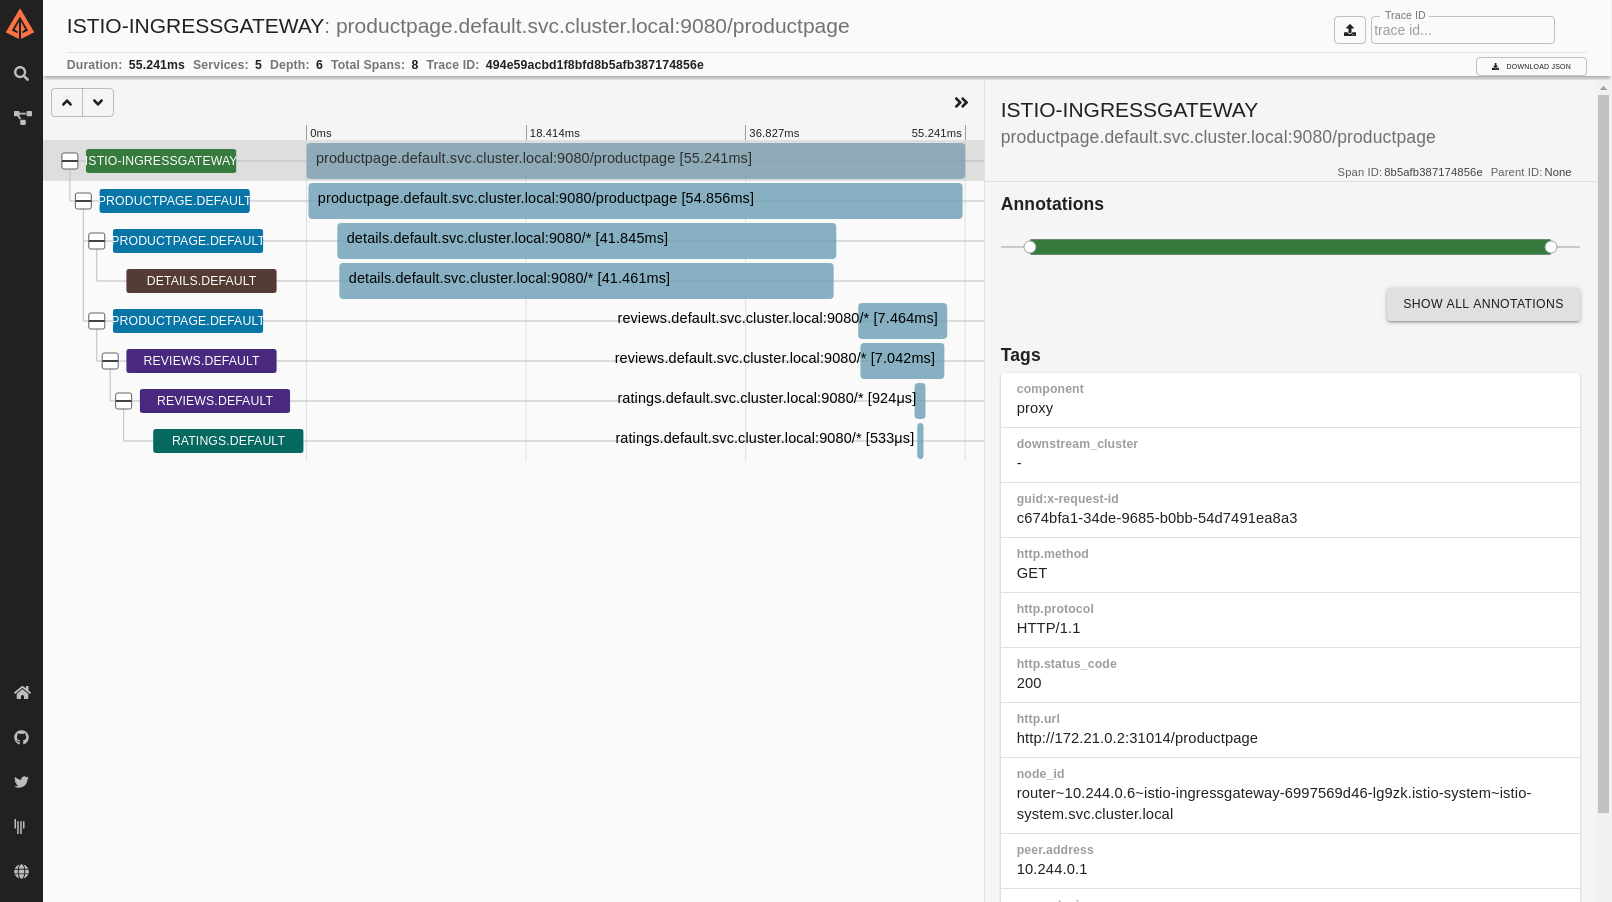
Istio Jaeger

Istio Zipkin

Additional Features Built In to the Istio Service Mesh and Their Current Status
Stable
Traffic management
| Feature | Phase |
| Protocols:HTTP1.1/HTTP2/gRPC/TCP | Stable |
| Protocols:Websockets/MongoDB | Stable |
| Traffic Control: label/content based routing, traffic shifting | Stable |
| Resilience features: timeouts, retries, connection pools, outlier detection | Stable |
| Gateway: Ingress, Egress for all protocols | Stable |
| TLS termination and SNI Support in Gateways | Stable |
| SNI (multiple certs) at ingress | Stable |
Observability
Beta
Traffic management
Observability
Security and Policy Enforcement
Core
Alpha
Traffic management
| Gateway Injection | Alpha |
| Enabling custom filters in Envoy | Alpha |
| CNI container interface | Alpha |
| DNS Proxying | Alpha |
| Kubernetes Service APIs | Alpha |
| Gateway Network Topology Configuration | Alpha |
Extensibility
| WebAssembly Extension | Alpha |
Core
You can monitor the status of each of these features as they progress at the following URL: https://istio.io/latest/docs/releases/feature-stages/Installing Prometheus and Grafana manually
Although we used Helm to install Prometheus and Grafana in the book, sometimes it's good to know what's going on behind the scenes. We can at least pay homage to the manual process for both Prometheus and Grafana.Prerequisites
Clone the kubernetes-prometheus repo using the following command.git \clone https://github.com/bibinwilson/kubernetes-prometheus
Create a Kubernetes namespace and ClusterRole for the service to live and authenticate to:kubectl create namespace monitoring
kubectl apply -n monitoring -f - <<EOF
apiVersion: rbac.authorization.k8s.io/v1
kind: ClusterRole
metadata:
name: prometheus
rules:
- apiGroups: [""]
resources:
- nodes
- nodes/proxy
- services
- endpoints
- pods
verbs: ["get", "list", "watch"]
- apiGroups:
- extensions
resources:
- ingresses
verbs: ["get", "list", "watch"]
- nonResourceURLs: ["/metrics"]
verbs: ["get"]
---
apiVersion: rbac.authorization.k8s.io/v1
kind: ClusterRoleBinding
metadata:
name: prometheus
roleRef:
apiGroup: rbac.authorization.k8s.io
kind: ClusterRole
name: prometheus
subjects:
- kind: ServiceAccount
name: default
namespace: monitoring
EOF
A file named prometheus-deployment.yaml can be found in the /etc/prometheus directory that contains the Prometheus deployment information. The file contents will look something like this:apiVersion: apps/v1
kind: Deployment
metadata:
name: prometheus-deployment
namespace: monitoring
labels:
app: prometheus-server
spec:
replicas: 1
selector:
matchLabels:
app: prometheus-server
template:
metadata:
labels:
app: prometheus-server
spec:
containers:
- name: prometheus
image: prom/prometheus
args:
- "--storage.tsdb.retention.time=12h"
- "--config.file=/etc/prometheus/prometheus.yml"
- "--storage.tsdb.path=/prometheus/"
ports:
- containerPort: 9090
resources:
requests:
cpu: 500m
memory: 500M
limits:
cpu: 1
memory: 1Gi
volumeMounts:
- name: prometheus-config-volume
mountPath: /etc/prometheus/
- name: prometheus-storage-volume
mountPath: /prometheus/
volumes:
- name: prometheus-config-volume
configMap:
defaultMode: 420
name: prometheus-server-conf
- name: prometheus-storage-volume
emptyDir: {}Create the prometheus deployment using the following command:kubectl create -f prometheus-deployment.yaml
View the state of the deployment using the following command:kubectl get deployments --namespace=monitoring
You can connect to the Prometheus dashboard via port-forwarding or exposing the service via NodePort or LoadBalancer setting if your Kubernetes cluster has load balancing configured or, you can use and ingress-controller if one is installed in your Kubernetes cluster. Here is a sample of the configuration file when using an ingress-controller:apiVersion: extensions/v1beta1
kind: Ingress
metadata:
name: prometheus-ui
namespace: monitoring
annotations:
kubernetes.io/ingress.class: nginx
spec:
rules:
# Use the host you used in your kubernetes Ingress Configurations
- host: prometheus.example.com
http:
paths:
- backend:
serviceName: prometheus-service
servicePort: 8080
You will need to perform the same steps as were executed for AlertManager using a different Config Map, Deployment and Service as was used in the Prometheus installation. The samples of the files for AlertManager can be found here: https://devopscube.com/alert-manager-kubernetes-guide/Finally, you would need to perform the same steps for Config Map, Deployment and Service installation of Grafana to enable the Grafana Visualization dashboard. The samples of the files required to perform the Grafana installation can be found here: https://devopscube.com/setup-grafana-kubernetes/Implementing Authorization as a Separate Component from Authentication
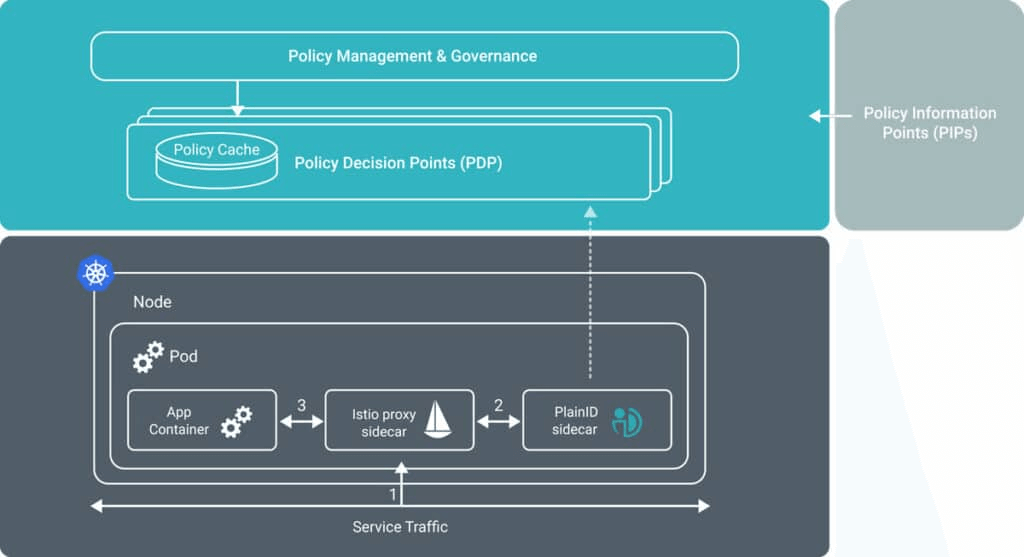
There is a very easy way to implement Authorization Policy enforcement for your microservices and applications if you have already decided to use Envoy as your proxy service. While doing research for this eBook, I came across a company called PlainID that provides the Policy generation, maintenance and enforcement mechanisms defined in the diagram above. PlainID runs as a sidecar next to each instance of Envoy in your deployment. When a request hits the Envoy proxy, it asks PlainID Sidecar directly for an authorization decision. PlainID provides the decisions to Envoy, and Envoy enforces it. The benefit to this architectural approach is that all decisions are made locally on the same server as the microservice and requires no network hops, yielding better availability and performance with minimal resource consumption. PlainID provides Policy Based Access Control (PBAC). PlainID's PBAC application offers a centralized approach to streamline secure business processes and to simplify back-office and IT permission management processes. "PlainID's approach ensures that the right users have access to the right data at the right time without the hold up of slow, sometimes even manual, internal processes." As stated by a major Financial Institution. The PlainID deployment looks like this when deployed against an Istio Service Mesh instance: Some of the key features of this approach include:
- Rapid and Controlled Deployment
- Policy Mining
- Compliance and SOD control
- Approval Workflows
- Graphical UI & REST API
- Visibility and Investigation
- Version Control
- Virtual Identities
- Universal Authorization
- Built in support for leading standards (LDAP, SQL, REST, SCIM)