OpenStack Metering Using Ceilometer
Here’s an overview of several projects to meter OpenStack infrastructure that are available:
- Zabbix is a general-purpose enterprise-class open source distributed monitoring solution for networks and applications that can be customized for use with OpenStack.
- Synaps is an AWS CloudWatch-compatible cloud monitoring software that collects metric data, provides statistics data, and monitors and notifies based on user-defined alarms.
- Healthmon by HP aims to deliver "Cloud Resource Monitor," an extensible service to the OpenStack Cloud Operating System by providing a monitoring service for Cloud Resources and Infrastructure.
- StackTach is a debugging and monitoring utility for OpenStack that can work with multiple datacenters, including multi-cell deployments.
- The Ceilometer project is the infrastructure to collect measurements within OpenStack so that only one agent is needed to collect the same data. Its primary targets are monitoring and metering, but the framework is expandable to collect usage for other needs.
What is Ceilometer in OpenStack?
In meteorology, a ceilometer is a device that uses a laser or other light source to learn the height of a cloud base. Thus, the Openstack Ceilometer project is a framework for monitoring and metering the OpenStack cloud and is also expandable to suit other needs.
Architecture of OpenStack Ceilometer
The primary purposes of the Ceilometer project are the following [1]:- The efficient collection of metering data in terms of CPU and network costs.
- Collecting data by monitoring notifications sent from services or by polling the infrastructure.
- Configuring the type of collected data to meet various operating requirements.
- Accessing and inserting the metering data through the REST API.
- Expanding the framework to collect custom usage data by additional plugins.
- Producing signed and non-repudiable metering messages.
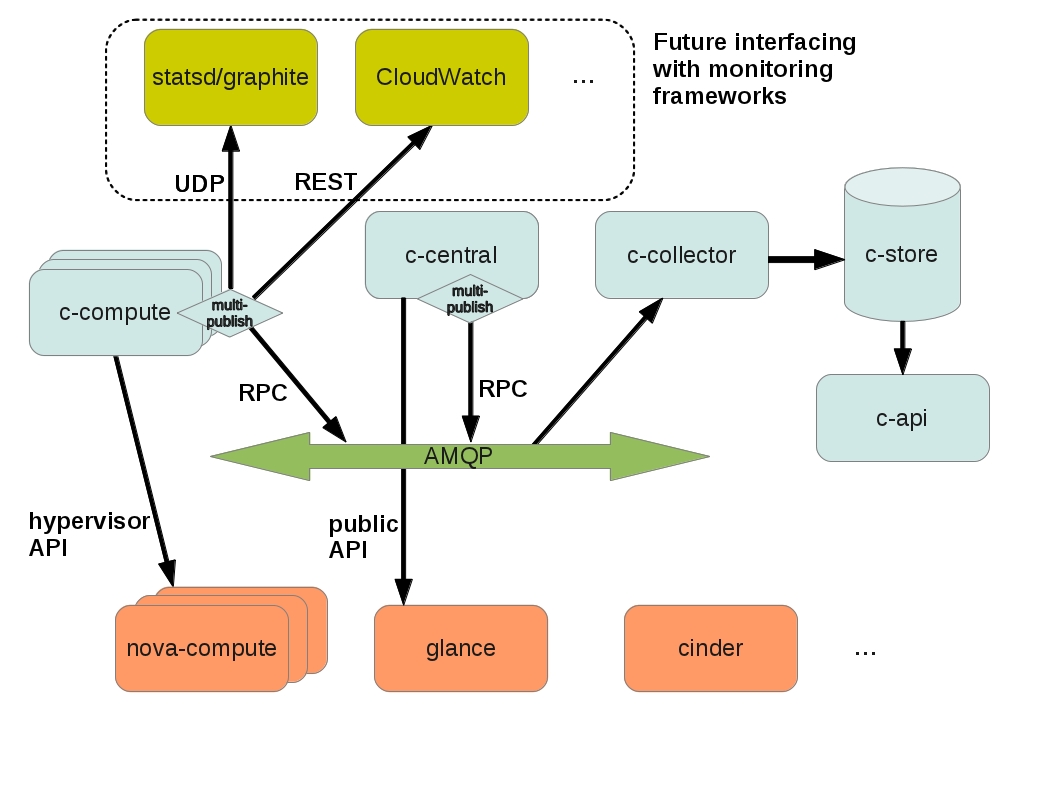
An API server provides access to metering data in the database via a REST API.
A central agent polls utilization statistics for other resources not tied to instances or compute nodes. There may be only one instance of the central agent running for the infrastructure.
A compute agent polls metering data and instances statistics from the compute node (primarily the hypervisor). Compute agents must run on each compute node that needs to be monitored.
A collector monitors the message queues (for notifications sent by the infrastructure and for metering data coming from the agents). Notification messages are processed, turned into metering messages, signed, and sent back out onto the message bus using the appropriate topic. The collector may run on one or more management servers.
A data store is a database capable of handling concurrent writes (from one or more collector instances) and reads (from the API server). The collector, central agent, and API may run on any node.
These services communicate using the standard OpenStack messaging bus. Only the collector and API server have access to the data store. The supported databases are MongoDB, SQL-based databases compatible with SQLAlchemy, and HBase; however, Ceilometer developers recommend MongoDB due to its processing of concurrent read/writes. In addition, only the MongoDB backend has been thoroughly tested and deployed on a production scale. A dedicated host for storing the Ceilometer database is recommended, as it can generate lots of writes [2]. Production scale metering is estimated to have 386 writes per second and 33,360,480 events a day, which would require 239 Gb of volume for storing statistics per month.
Integration of related projects into Ceilometer
With the growth of OpenStack to production level, more missing features are needed for its successful usage as a cloud provider: billing system, usage statistics, autoscaling, benchmarking, and troubleshooting tools. After several projects were started to fulfill these needs it became clear that great part of their monitoring implementation has a common functionality.In order to avoid fragmentation and functionality duplication, related projects will be integrated to provide a unified monitoring and metering API for other services. Because they had the same goal for metering, the Healthmon project was integrated into Ceilometer, but their data model and collection mechanisms were different [4]. A blueprint for Healthmon and Ceilometer integration has been created and approved for the OpenStack Havana release. The Synaps and StackTach projects had some unique functionality and are being integrated into Ceilometer as additional features. The main reason for Ceilometer’s survival and integration of other projects is not the overwhelming features list implemented, but rather its good modularity. Most other metering projects would have implemented limited metering and some additional specific functionality. Ceilometer, however, will provide a comprehensive metering service and API to the obtained data to build any other feature, whether it’s billing, autoscaling, or performance monitoring.
The cloud applications orchestrator project, OpenStack Heat, is also going to build its metric and alarm backend on top of Ceilometer API, which will allow implementation of such features as autoscaling [3]. This process includes introducing the alarm API and the ability to post metering samples via REST requests to Ceilometer and also rework Heat to make the metric logic pluggable.
Integration will extend the Openstack Ceilometer API with additional features and plugins and result in the following modifications in its architecture [5]:

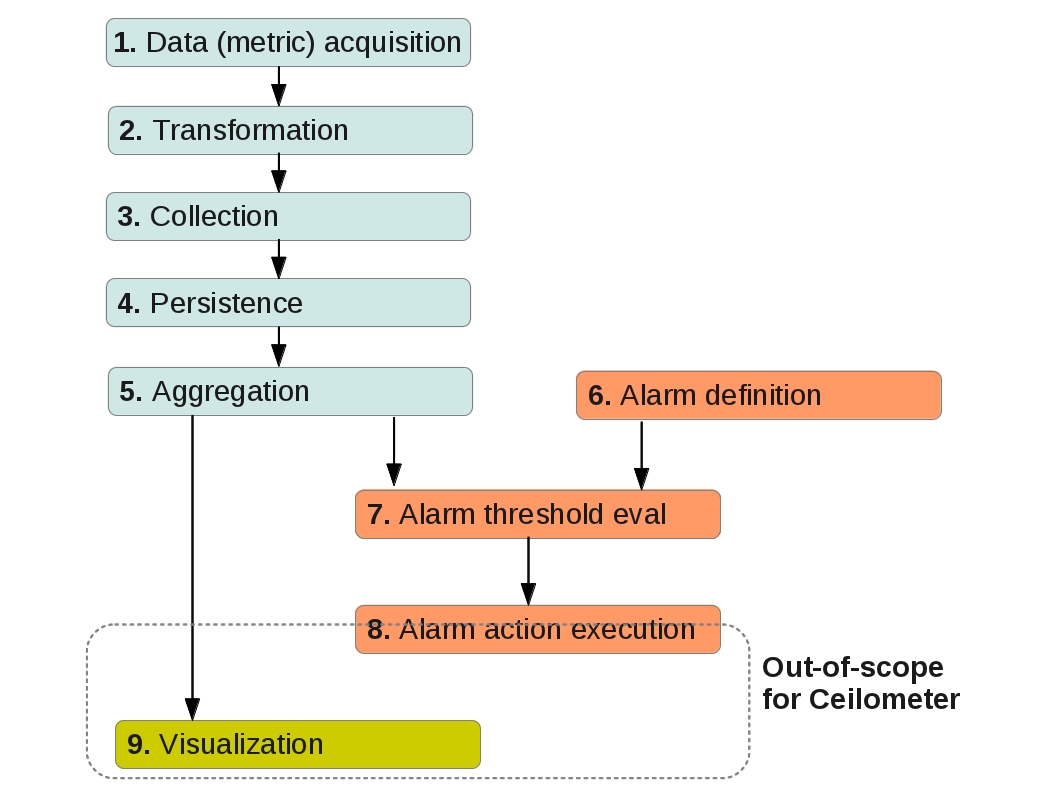
Most of the integration and additional features are planned for the OpenStack Havana release. The primary roadmap for Ceilometer is to cover most of the metering and monitoring functionality and provide the possibility for other services (CLI, GUI, visualization, alarm action execution, etc.), to be built around the Ceilometer API.

Measurements in Ceilometer
Three type of meters are defined in ceilometer:- Cumulative: Increasing over time (for example, instance hours)
- Gauge: Discrete items (for example, floating IPs or image uploads) and fluctuating values (such as disk I/O)
- Delta: Changing over time (for example, bandwidth)
– counter_name The string for meter id. As a convention, the ‘.’ separator is used to go from least to most discriminant word (for example, disk.ephemeral.size).
– counter_type One of the described counter types (cumulative, gauge, delta).
– counter_volume The amount of measured data (CPU ticks, bytes transmitted through network, provisioning time, etc.). This field is irrelevant for gauge-type counters and should be set to some default value in this case (usually: 1).
– counter_unit The description of the counter unit of measurement. Whenever a volume is to be measured, SI-approved units and their approved abbreviations will be used. Information units should be expressed in bits ('b') or bytes ('B'). When the measurement does not represent a volume, the unit description should always precisely describe what is measured (instances, images, floating IPs, etc.).
– resource_id The identifier of the resource being measured (UUID for instance, network, image, etc.).
– project_id The project (tenant) ID the resource belongs to.
– user_id The User ID the resource belongs to.
– resource_metadata Some additional metadata taken from the metering notification payload.
A full list of currently provided OpenStack Ceilometer metrics may be found in the OpenStack Ceilometer documentation [6].
Ceilometer Features
Due to active development of Ceilometer and its integration with other projects, many additional features are planned for the OpenStack Havana release as blueprints. The upcoming and already implemented functionality is described below [7].Post metering samples via the Ceilometer REST API
Implementation of this blueprint allows posting of metering data using Ceilometer REST API v2. A list of counters to be posted should be defined in JSON format and sent as a POST request to url http://<metering_host>:8777/v2/meters/<meter_id> (counter name corresponds to meter id). For example:[This enables the custom agents to post metering data to Ceilometer with minimum effort.
{
"counter_name": "instance",
"counter_type": "gauge",
"counter_unit": "instance",
"counter_volume": "1",
"resource_id": "bd9431c1-8d69-4ad3-803a-8d4a6b89fd36",
"project_id": "35b17138-b364-4e6a-a131-8f3099c5be68",
"user_id": "efd87807-12d2-4b38-9c70-5f5c2ac427ff",
"resource_metadata": {
"name1": "value1",
"name2": "value2"
}
}
]
Alarms API in Ceilometer
Alarms will allow monitoring of a meter's state and notifications once some threshold value has been reached. This feature will enable numerous capabilities to be based on Ceilometer, like autoscaling, troubleshooting, and any other actions of infrastructure. The corresponding Alarm API blueprint is approved with high priority and planned for the Havana release.Extending Ceilometer API
Ceilometer API will be extended to provide advanced functionality needed for billing engines, such as:- Maximum usage of a resource that lasted more than 1 hour;
- Use of a resource over a period of time, listing changes by increment of X volume over a period of Y time;
- Providing additional statistics (Deviation, Median, Variation, Distribution, Slope, etc.).
Metering Quantum Bandwidth
Ceilometer will be extended for computing network bandwidth with Quantum. The Meter Quantum bandwidth blueprint is approved with medium priority for the Havana-3 release.Monitoring Physical Devices
Ceilometer will monitor physical devices in the OpenStack environment, including physical servers running Glance, Cinder, Quantum, Swift, Nova compute node, and Nova controller and network devices used in the OpenStack environment (switches, firewalls). The Monitoring Physical Devices blueprint is approved for the Havana-2 release and its delivery is already in the process of code review.Extending Ceilometer
Ceilometer was designed for easy extension and configuration, so it can be tuned each time you install it. A plugin system based on setuptools entry points provides the ability to add new monitors in the collector or subagents for polling.Two kinds of plugins are expected: pollsters and listeners. Listeners process notifications generated by OpenStack components and put into a message queue to construct corresponding counter objects. Pollsters are for custom polling of infrastructure for specific meters, notifications for which are not put in a message queue by OpenStack components. All plugins are configured in the setup.cfg file as [entry_points] section. For example, to enable custom plugins located in the ceilometer/plugins directory and defined as MyCustomListener and MyCustomPollster classes, the setup.cfg file should be customized as follows:
[entry_points]The purpose of pollster plugins is to retrieve needed metering data from the infrastructure and construct a counter object out of it. Plugins for the central agent are defined in the ceilometer.poll.central namespace of setup.cfg entry points, while for compute agents they are the in ceilometer.poll.compute namespace. Listener plugins are loaded from the ceilometer.collector plugin.
ceilometer.collector =
custom_listener = ceilometer.plugins:MyCustomListener
...
ceilometer.poll.central =
custom_pollster = ceilometer.plugins:MyCustomPollster
...
The heart of the system is the collector, which monitors the message bus for data being provided by the pollsters as well as notification messages from other OpenStack components such as Nova, Glance, Quantum, and Swift.
A typical listener plugin must have several methods for accepting certain notifications from the message queue and generating counters out of them. The get_event_types() function should return a list of strings containing the event types the plugin is interested in. These events will be passed to the plugin each time a corresponding notification arrives. The notification_to_metadata() function is responsible for processing the notification payload and constructing metadata that will be included into metering messages and accessible via Ceilometer API. The process_notification() function defines the logic of constructing the counter using data from specific notifications. This method can also return an empty list if no useful metering data has been found in the current notification. To create the counters the ceilometer.counter.Counter() constructor is used which accepts the required counter fields value (see Measurements). The meters provided by Ceilometer are implemented as plugins as well and may be used as a reference for creating additional plugins.
Summary
Ceilometer is a promising project designed to provide comprehensive metering and monitoring capabilities by fulfilling the functionality required to implement numerous features necessary for OpenStack production and enterprise use. Even though Ceilometer already has stories of deployment (CloudWatch, Dreamhost [5]), many changes and additional features will be developed by October 2013. Therefore, the project should be much better suited for production use after the development team releases Havana, when most significant blueprints will be implemented.References
- [1] Ceilometer Developer Documentation
- [2] Ceilometer: Choosing database backend
- [3] Blueprint: Move to Ceilometer as Heat CloudWatch metric/alarm back-end
- [4] Ceilometer and Healthmon integration
- [5] Ceilometer Graduation
- [6] OpenStack Ceilometer Documentation: Measurements
- [7] Ceilometer blueprints approved for Havana release


