StackLight
Operations Support System for Mirantis Container Cloud and Mirantis Cloud Platform
Operations Support System for Mirantis Container Cloud and Mirantis Cloud Platform
When you are moving fast and delivering flexible infrastructure at scale, things will inevitably break. This is ok as long as you have the deep operational insights and tools to keep your clouds running smoothly.
Every lost minute means a potential loss of thousands of dollars in productivity, business transactions, even sales. This places high emphasis on the tooling to identify and address issues in the shortest amount of time – before the problem becomes serious.
Mirantis StackLight is our proactive monitoring, logging and alerting solution – providing complete operational visibility and management tooling that helps get you to production-readiness quickly and ensures maximum availability once you’re in production.
StackLight is designed for large-scale container and cloud observability, and customized heavily for Mirantis Container Cloud and MCP, including extensive collectors, dashboards, trend reporting and alerts. In the case of Mirantis Cloud Platform, StackLight is set up to monitor every service and component in a multi-cloud distributed hierarchy: from top-level MCC manager and Region clusters, to Mirantis Kubernetes Engine child clusters. In MCP’s case, StackLight is preconfigured for all monitored services and components.
StackLight is engineered to work with lifecycle management, letting you catch problems early and roll back updates, and use pre-configured triggers to automatically scale/adjust infrastructure services before problems arise.

In both Mirantis Container Cloud and MCP, StackLight can form the basis for policy-driven automation that further simplifies system management, enabling faster times to value and better SLAs.

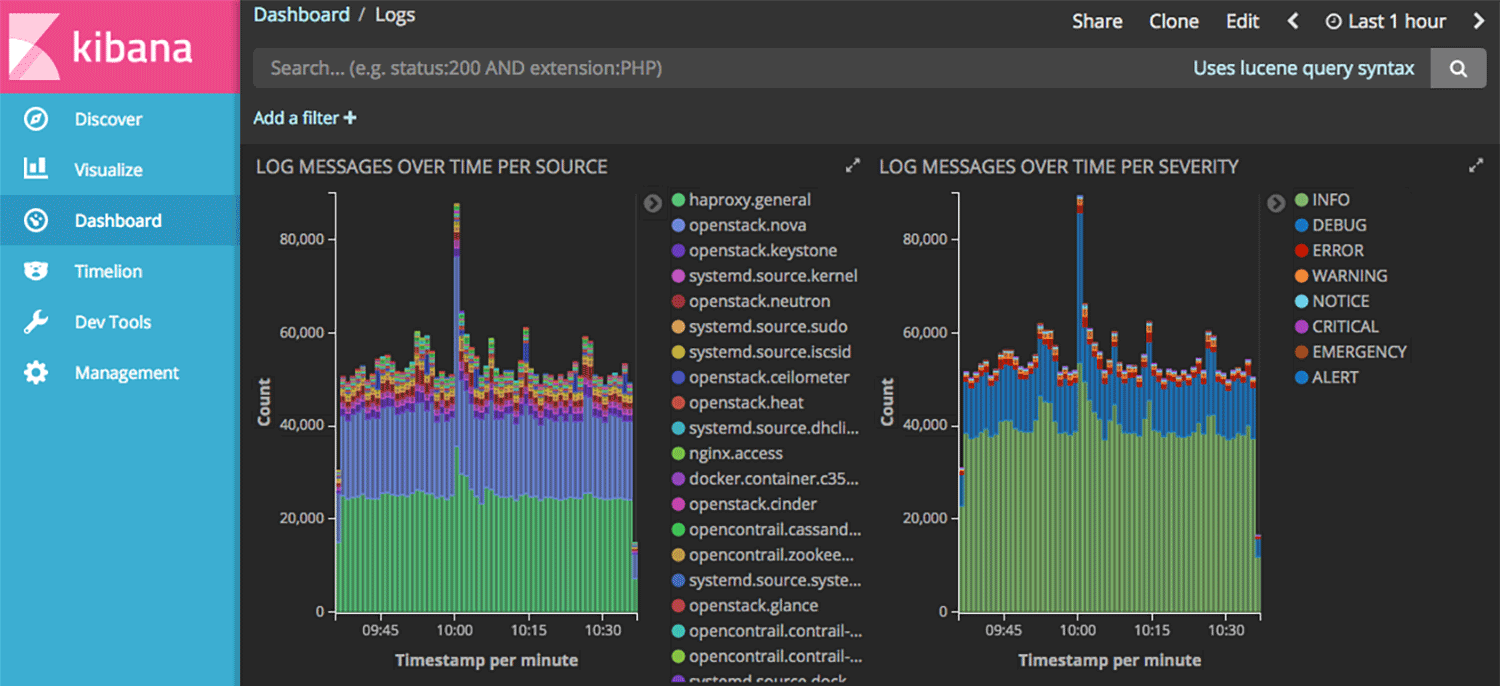
StackLight utilizes Elasticsearch and Kibana to intelligently collect relevant log information, correlate events and create custom views for visualization. The retention period is customizable. The logging solution can be scaled up in response to a growing cloud without data loss or reinstallation.

StackLight monitors the health of your MCC and/or MCP cloud and provides relevant metrics and events. It is based on InfluxDB and Grafana, and precisely indicates which service caused the failure, helping to slash the time required to solve issues. Similar to logging, the retention period is customizable.

StackLight utilizes Prometheus for providing low latency alert responses to events across the entire MCC or MCP open cloud environment, including OpenStack, Kubernetes, Ceph and SDNs like Calico and Tungsten Fabric. There are built-in alerts on anomaly and fault detection (AFD) metrics that can be extended to create custom alerts. The alarms can be exported to other systems via standard protocols such as SNMP.

Our integration with the Prometheus project gives you visibility into the metrics of your containerized workloads, as well as insight into historical trends so you can understand how well your clouds are working over time. Stacklight provides dashboards in Grafana that help you analyze historical behavior, spot trends, and ensure your clouds continue to run smoothly.

![]()
![]()

Mirantis StackLight was designed for our operations team and yours – and it is 100% open source. With Mirantis OpsCare, our build-operate-transfer solution, you can quickly deliver the flexible, private-cloud infrastructure you need and when you’re ready you can seamlessly transfer operations to your IT organization using the same in-place tooling and same in-place operating procedures used by Mirantis.